Watching A Systematic Model At Work
2018 was a demanding year in equity markets. Using signals combined from multiple hedge funds, however, we can take a systematic approach to manage equity risk during any type of market environment.
Managing a global equity portfolio through different market regimes
2018 was a demanding year for discretionary and systematic managers
MSCI-All-Country-World-Index in 2018
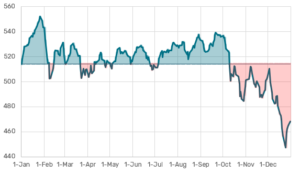
Source: Bloomberg / Sanostro
The chart above illustrates the challenges an equity investor faced in 2018. January 2018 was strong and still dominated by the bull sentiment of 2017, February to September a sideways market with high volatility and no clear direction, the last quarter then clearly bearish. Three regimes in a single year. The overall 2018 result: -9%.
How vital is your defense after many bull market years?
Adjusting your betas when the market is running in circles is a daunting task. Especially after many bull years with a defense largely unchallenged. Hence, 2018 proved to be a year of reckoning for systematic and discretionary risk managers alike.
Dynamically adjusted market exposure
The example we refer to here is based on a systematic approach to dynamically adjust the market exposure of an ACWI benchmarked portfolio. The adjustment process is granular, scaling the exposure to each of the major equity indices individually from 0 to 100% using a combination of slower and faster models. Mixing risk management signals from different quant providers reduces model risk and smoothen the performance over the cycles.
A rule-based approach offers a disciplined implementation of market insights
Overall, the dynamically adjusted portfolio did not only embed a systematic risk management process, potentially avoiding large drawdowns, but also generated 2.9% outperformance versus the benchmark in 2018. In 2019 the approach quickly turned “risk-on” again, capturing the upside. To get a better picture of how the strategy reacted to changing market conditions, let’s zoom into the monthly relative performances.
Market defense in 2018 – Performance pattern
Sanostro strategy outperformance in 2018
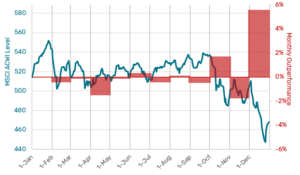
Source: Bloomberg / Sanostro
Managing downside through different market regimes

It’s revealing to watch the systematic process to manage market exposure through the different market regimes of 2018: January was still dominated by the bull sentiment of 2017. The model behind the systematic process was relaxed, going “full throttle” with 100% market exposure. This is the optimal “pedal position” during a bull market, it means full upside capture with no out- or under-performance relative to the benchmark. The best you can expect from your defense in that regime.
Volatile sideway markets are costly
When the markets turned into a sideway regime in February, with sharp ups and downs, the defense mode got partially turned on. The bear is rigorously testing the markets, fighting with the bull, with no clear winner. The model is watching and interpreting this fight, reducing exposure when the bear gains the upper hand, increasing exposure when the bull is leading. Constant readjustments in V-shaped price environments are costly. An unfortunate but immutable characteristic of dynamic management: You tend to be wrongfooted when markets are nervous but indecisive. Keeping this “volatility cost” low is an important model quality. The portrayed strategy lost about 2.6% relative to the benchmark in the period from February to September.
Vigilance finally paid out in Q4
Eventually, the bear got the upper hand. We saw sharp corrections in October and December, intermitted by a rebound in November. The vigilance, costly over the previous months, is now paying out. It reduces the drawdown considerably, leading to around 5.5% outperformance versus the MSCI ACWI benchmark.
What can we learn?
Accurately predicting the exact moments when markets are going to crash is impossible. But analyzing market patterns gives you a sense of how nervous the market is. A systematic model is doing exactly that. It follows clear audible rules of how to reduce exposure based on the stress level detected in price patterns. This approach gives systematic guidance to money managers during turbulent periods and yields a good chance to pull out of the market before you suffer extensive losses.